

Zdjęcia na tkaninie autora Anch
FILTRUJ WYNIKI
Orientacja obrazów: wszystkie
pozioma
pionowa
kwadratowa
Rodzaj obrazów: wszystkie
zdjęcie
ilustracja
wektor
Zastosuj
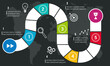
#412172322
 Inclusion and diversity infographic vector set, people vector logo for website
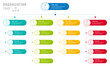
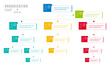
#430893771
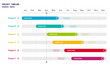
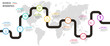
 Project Timeline Infographics in board game design, company roadmap, timeframe, milestones and...
#498448432
 Inclusion and diversity infographic vector set, social and cultural inclusion diversity
#432084650
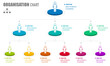
 Corporate organisation chart with business people icons. Vector illustration
#393555482
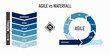 Agile vs Waterfall methodology for software development life cycle diagram
#392445797
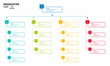
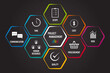
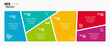 Infographics design vector and business icons with 6 options for presentation and web site
#430084611
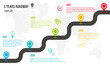 Project roadmap, timeline Infographics, 5 years recap, timeframe, milestones and achievements
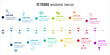
#396302096
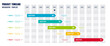
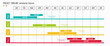 Project Timeline Infographics, 12 months timeframe and milestones
#432084643
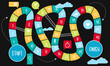 Colorful Board Game Vector Template, Business plan board game, snake and ladder game
#423979560
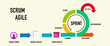
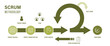 Scrum Agile methodology for software development life cycle diagram
#410128567
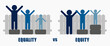 Equality and Equity Concept Illustration. Human Rights, Equal Opportunities and Respective Needs....
#474615499
 Inclusion and diversity infographic vector set, people vector logo for website
#396983381
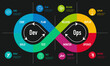 DevOps, software development and IT Operation methodology
#403529817
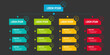 Corporate organisation chart with business people icons. Vector illustration
#472547173
 Infographics design vector and business icons with 10 options for presentation and web site
#423979620
 Agile vs Waterfall methodology for software development life cycle diagram
#415080246
 Equality and Equity Concept Illustration. Human Rights, Equal Opportunities and Respective Needs....
#422431338
 Project Timeline Infographics, 12 months timeframe and milestones
#505612967
 Corporate organisation chart with business people icons. Vector illustration
#429329236
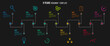
 Inclusion and diversity infographic tree vector set, multi color leaves represent inclusion and...
#392013621
 People Infographics, gender pictographic vector for presentation and website
#433182338
 Project roadmap, timeline Infographics, 9 years recap, timeframe, milestones and achievements
#414919093
 Corporate organization chart with business people icons. Vector illustration.
#473439540
 Project roadmap, timeline Infographics, 9 years recap, timeframe, milestones and achievements, 9...
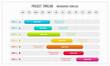
#420767430
 Project Timeline Infographics, 12 months timeframe and milestones with percentage of completion
#405806338
 Scrum Agile methodology for software development life cycle diagram
#433182361
 Inclusion and diversity infographic tree vector set, multi color leaves represent inclusion and...
#432084629
 Corporate organisation chart with business people icons. Vector illustration
#415080170
 12 years roadmap, project milestones, timeline infographics for annual report and presentation
#393555443
 Project Timeline Infographics, 12 months timeframe and milestones
#427790218
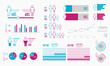
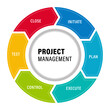 Presentation of project management life cycle vectors
#388272692
 Presentation of project management areas of knowledge such as cost, time, scope, human resources,...
dodaj do ulubionych