

Szkło zmienności, zmienności płytki szklane, panel szklany zmienności, zmienności na szkle
FILTRUJ WYNIKI
Orientacja obrazów: wszystkie
pozioma
pionowa
kwadratowa
Rodzaj obrazów: wszystkie
zdjęcie
ilustracja
wektor
Zastosuj
#787426697
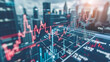
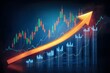 Uptrend arrow enhances financial stats, candlesticks depict economy
#779631668
 The volatility of the cryptocurrency markets with fluctuating price charts and geometric patterns...
#772493880
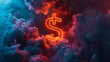 A dramatic 3D animation depicts a neon-lit dollar sign emerging from dark, swirling smoke,...
#781760688
 stock market fluctuations and market volatility
#774696618
 Digital stock market graph with downtrend arrows depicting a financial crisis, on a dark background...
#263752653
 volatility of the cryptocurrency concept. Candle chart of the rise and fall of prices on the stock...
#783244441
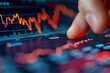 Close-up on a hand with a finger extended towards a sharp decline in a line graph, highlighting...
#791993035
 Financial market graph with rising arrow symbolizing investment growth and data analysis. Concept...
#787167525
 A fractured globe with ticker symbols of major stock markets superimposed, flashes of red and green...
#780495387
 Inflation Echoes in Aisle Shelves: The Retail Rhythm. Concept Retail Trends, Consumer Behavior,...
#775840366
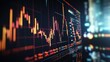
 A computer screen shows a graph of stock prices. The graph is red and black, with the red lines...
#692327157
 A bar graph displaying the performance of individual stocks within a portfolio, with some stocks...
#793350019
 Cryptocurrency exchange, digital assets trading, blockchain technology, decentralized finance,...
#691994125
 Stick graph chart with indicator showing bullish point or bearish point, up trend or down trend of...
#773202072
 digital screen displaying real-time Bitcoin trading charts and graphs, with glowing neon lines on a...
#795272814
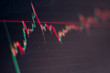
 Chart candle stock graph forex market. Trade chart exchange background crypto currency.
#723259177
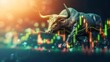 Green suited bull with rising charts symbolizing trading volatility and recession in bull market.
#726007285
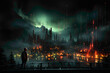
 Cityscape overlaid with stock market crash graphs at dusk
#788918147
 Abstract stock market graph on dark background
#762312443
 Graphical representation of market sentiment through a captivating blend of green and red hues on a...
#785759026
 An options trader analyzing volatility levels and implied probabilities, crafting complex trading...
#778244361
 Histogram of daily trading volumes for a highvolatility cryptocurrency hyper realistic
#739979881
 Animated market volatility graph with lightning speedlight effects on a shadowy backdrop depicting...
#781014168
 Animated graph of historical oil price fluctuations, with key events marked for context,
#748115849
 A 3D glass sculpture of rising and falling forex trading graphs embodying the volatility and beauty...
#726705013
 A dynamic visual concept of finance,crypto concept
#703821969
 An abstract depiction of market volatility captured through an interplay of colors and shapes,...
#752694187
 Gross domestic product metaverse business finance stock exchange trading graph chart global market...
#710314508
 Implementing Dollar-Cost Averaging (DCA) in investment, individuals steadily contribute funds over...
#788193027
 Futuristic Financial Landscape: Market Pulse in Neon Vibes. Concept Finance Trends, Neon Aesthetics,...
#787220397
 Exchange Traded Funds (ETFs), Illustrate scenes of ETF trading, ETF creation and redemption...
#692384795
 A captivating sculpture made of transparent materials displaying intricate stock market graphs,...
dodaj do ulubionych