

Szkło chart, chart płytki szklane, panel szklany chart, chart na szkle
FILTRUJ WYNIKI
Orientacja obrazów: wszystkie
pozioma
pionowa
kwadratowa
Rodzaj obrazów: wszystkie
zdjęcie
ilustracja
wektor
Zastosuj
#211364950
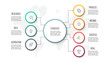
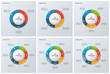 Set of modern style circle donut charts, infographic designs, vi
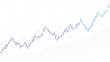
#441320165
 Market chart of business increase stock graph or investment financial data profit on growth money...
#178216009
 Transition effect in bar chart statistics and bright windows
#287420143
 abstract financial chart with uptrend line candlestick graph in stock market on white color...
#198177190
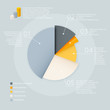 Pie chart diagram vector infographics design element mockup template
#438495453
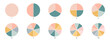 Pie chart color icons. Segment slice sign. Circle section graph. 1,2,3,4,5 segment infographic....
#132045270
 Infographic elements vector
#168481805
 Business candle stick graph chart of stock market investment trading on dark background design....
#297712620
 Pie chart full set, ring percentage diagram collection, loading circle icon, black isolated on white...
#335032073
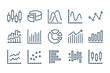 Graph and Chart related line icons. Statistics and analytics vector icon set.
#375137228
 Presentation infographic. Vector flowchart timeline process chart, organization workflow, number...
#169616848
 Business infographic. Organization chart with 7 options. Vector template.
#115902615
 Growth chart - vector icon
#139341144
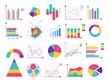
 Dashboard infographic template with modern design weekly and annual statistics graphs. Pie charts,...
#469106231
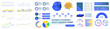
 Full pack infograpic collection
#415820699
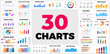 30 Infographics. Column, bar, line charts. Business financial reports. Marketing structure. Daily,...
#186686542
 Financial data graph chart, vector illustration. Trend lines, columns, market economy information...
#307358595
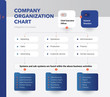 Company Organization Chart. Structure of the company. Business hierarchy organogram chart...
#202441966
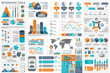
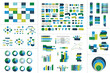 Mega set of Infographic element. Vector.
#211567120
 Abstract financial chart with uptrend line graph on blue background.
#154340281
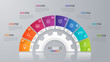 Vector circle chart template for infographics with 8 options.
#237815984
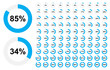
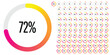 Set of circle percentage diagrams (meters) from 0 to 100 ready-to-use for web design, user interface...
#341638056
 Modern infographic template with stock diagrams and statistics bars, line graphs and charts for...
#243879818
 Widescreen Abstract financial graph with uptrend line arrow and bar chart of stock market on blue...
#392859631
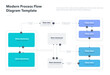 Modern process flow diagram template. Flat infographic, easy to use for your website or...
#559082250
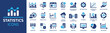 Statistics icon set. Containing data, web statistics, survey, prediction, presentation, cloud...
#600977965
 Perspective view of stock market growth, business investing and data concept with digital financial...
#187884618
 Business candle stick graph chart of stock market investment trading on dark background design....
#232926981
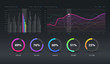
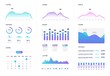 Ui dashboard. Modern infographic with gradient finance graphs, statistics chart and column diagrams....
#435985707
 Vector Infographic design business template with icons and 9 options or steps. Can be used for...
#354007466
 Stock market and trading, digital graph
#255954008
 Business colorful pie chart template with circle in the center. Background for your documents, web...
dodaj do ulubionych